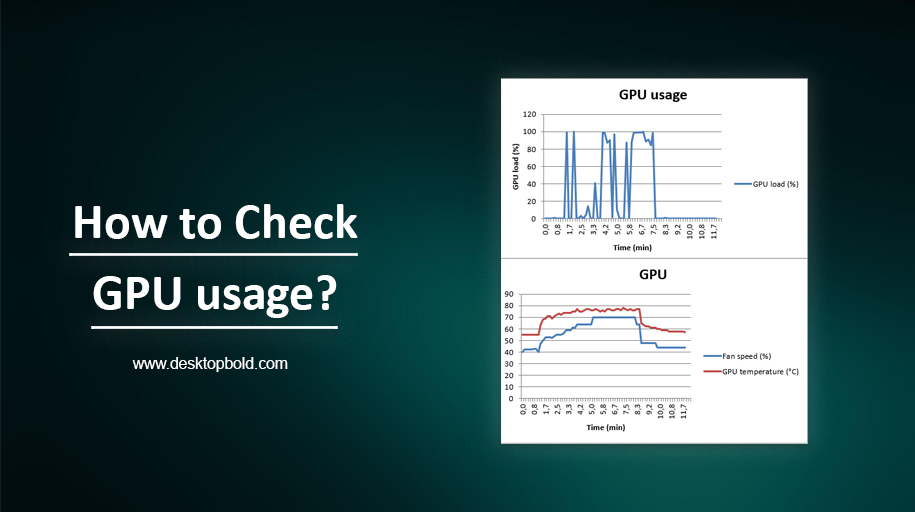
GPU (Graphics Processing Unit) usage refers to the number of resources and time the GPU is spending to perform a task. For example, your GPU usage will be high when you play a video game or run graphic-intensive applications. Monitoring GPU usage is crucial for ensuring that your computer is running at optimal performance and avoiding overheating and other issues. If the GPU is overused, it can cause the computer to slow down or even crash.
In this article, we will provide a comprehensive guide on how to check GPU usage on different operating systems, including Windows, macOS, and Linux. We will cover built-in tools and third-party software options for monitoring GPU usage, allowing you to choose the best method. By the end of this article, you will have a better understanding of GPU usage and the tools available to monitor it.
What is GPU Usage?
GPU usage refers to the number of resources and time the GPU is spending to perform a task. It is expressed as a percentage, with 100% indicating that the GPU is fully utilized. GPU usage is an important metric to monitor, as it provides insight into the performance of the GPU and the overall system.
The utilization of a GPU is determined by dividing the number of clock cycles it has performed by the maximum number of clock cycles it is capable of performing. The result is expressed as a percentage, with 100% indicating full utilization of the GPU.
The GPU usage can be affected by several factors, including the graphics settings of the applications being run, the amount of available VRAM, and the cooling performance of the GPU. Additionally, the performance of other components in the system, such as the CPU, memory, and storage, can also impact GPU usage. Running multiple applications simultaneously can also increase GPU usage, as the GPU has to work harder to handle the increased workload.
Checking GPU Usage on Windows:
Here are the different ways to check GPU Usage on Windows.
How to Check GPU Usage using the Task Manager?
You can check the GPU usage on Windows using Task Manager. Here are the steps:
- To open the Task Manager, simultaneously press Ctrl + Shift + Esc.
- Go to the “Performance” tab and select “GPU.”
- Here you will see the usage details of your GPU, including utilization, memory usage, and temperature.
Note: The GPU information is only available if your GPU is supported by Windows. Also, the exact information you see may depend on the GPU model and the graphics driver version you have installed.
How to Check the GPU Usage using the Performance Monitor?
To check the GPU usage on a Windows machine using the Performance Monitor, follow these steps:
- To open the Run dialog box, press the Windows key + R.
- Type “perform” and press Enter to open the Performance Monitor
- Click on the “Performance Monitor” option in the left-side menu
- Right-click on the graph and select “Add Counters.”
- Select the GPU instance you want to monitor from the list of available performance objects
- Select the “% GPU Time” counter and click “Add.”
- Click “OK” to close the “Add Counters” window
- The graph should now display the GPU usage over time.
Note: You may need to install the GPU manufacturer’s proprietary drivers and software to access GPU performance metrics.
How to Check GPU Usage using Third-party Software?
There are several third-party software tools available for checking GPU usage on Windows, including:
- MSI Afterburner: A graphics card overclocking utility that monitors and logs GPU performance metrics.
- GPU-Z: A system utility, designed to give information about video cards and GPUs, that is lightweight in nature.
- HWiNFO: A system information and diagnostic tool that provides real-time monitoring of GPU usage, among other metrics.
- AIDA64: A system diagnostic and benchmarking tool that provides comprehensive information on hardware and software, including GPU usage and other performance metrics.
If you are worried about how to check GPU usage without a task manager, then don’t worry. These tools typically monitor GPU usage, temperature, clock speeds, fan speed, and other performance metrics. You can use any of these tools to monitor your GPU performance and ensure it functions optimally.
Checking GPU Usage on macOS:
Here are the different ways to check GPU Usage on macOS.
How to Check GPU Usage using the Activity Monitor?
To check the GPU usage on a Mac running macOS, follow these steps:
- Open the Activity Monitor by searching for it in Spotlight or navigating to Applications > Utilities > Activity Monitor.
- In the Activity Monitor, select the “GPU History” tab.
- You should see a graphical representation of your GPU usage over time and information about the utilization of each GPU in your system.
Note: On some Mac models, you may need to enable the “Debug > Show GPU History” option in the Activity Monitor preferences to view the GPU usage information.
How to Check GPU using Third-party Software?
Using third-party software to lower CPU/GPU usage in games is a standard method. There are many applications available that can help to monitor and control the usage of your computer’s resources. These tools can set limits on the maximum usage of the GPU, as well as monitor other vital parameters such as temperature and power consumption. Some popular third-party tools for lowering gaming GPU usage include MSI Afterburner, Rivatuner Statistics Server, and CPU-Z. Using these tools, you can fine-tune the performance of your computer for gaming and ensure that the system is running at optimal levels.
Checking GPU Usage on Linux:
To check GPU usage on Linux, you can use the following methods:
- Nvidia-smi: If you have an NVIDIA GPU, you can use the Nvidia-semi tool that comes with the NVIDIA GPU drivers. To use it, open a terminal and type “nvidia-smi.”
- htop: Htop is a process monitoring tool that shows real-time system utilization and resource consumption. You can install htop by typing “sudo apt-get install htop” in a terminal. Once installed, type “htop” in a terminal to open it, and look for the “GPU” section to see GPU utilization.
- Top: Similar to htop, the top command provides an overview of the system’s resource usage. To see the GPU usage, type “top” in a terminal and look for the ” %GPU” line.
Note: For systems with multiple GPUs, you may need to specify the GPU you want to monitor using the GPU ID.
Conclusion
In conclusion, monitoring GPU usage is crucial for ensuring the optimal performance of a system. Users can identify performance bottlenecks and take necessary measures to resolve them by keeping track of GPU utilization. This can be done through various methods, including using built-in tools such as Task Manager, performance monitor, and GPU monitoring software. By following the steps outlined in the article and implementing these techniques, users can optimize their GPU usage and ensure their system runs at its best.